
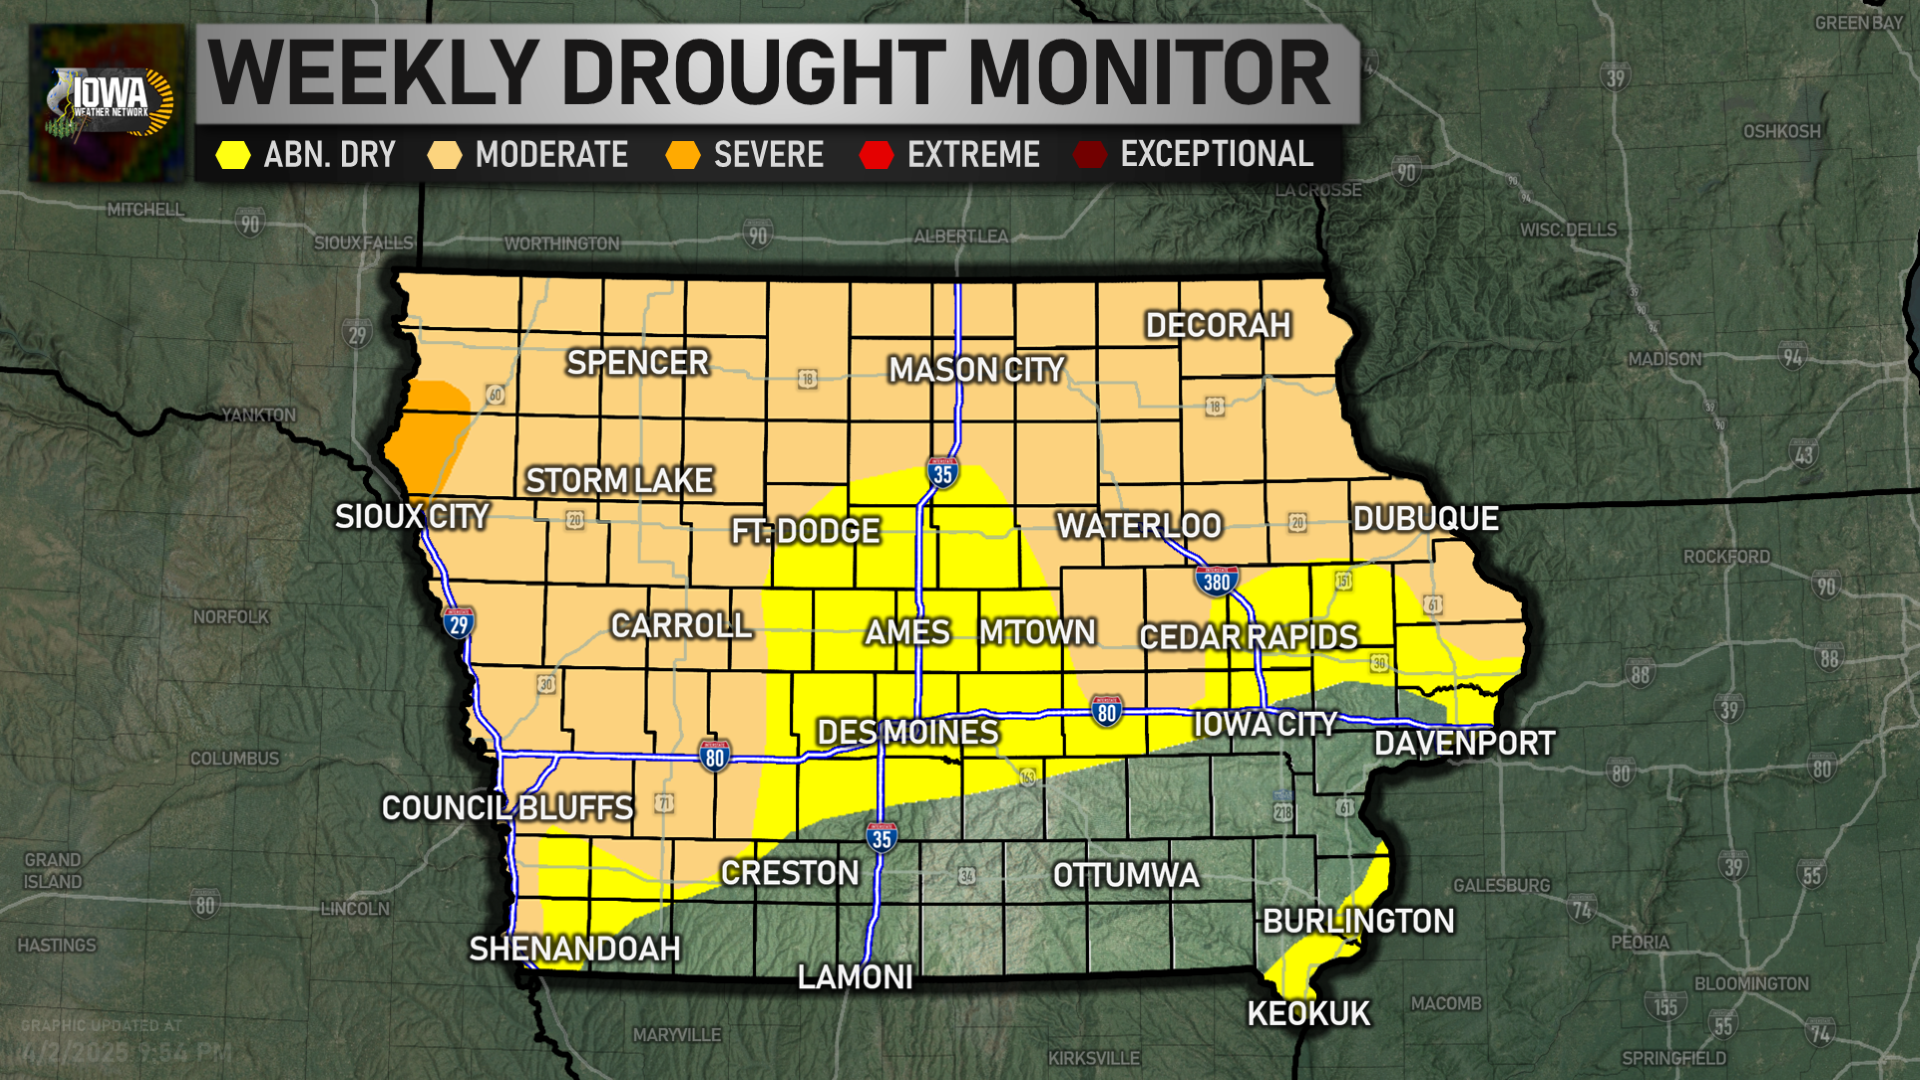
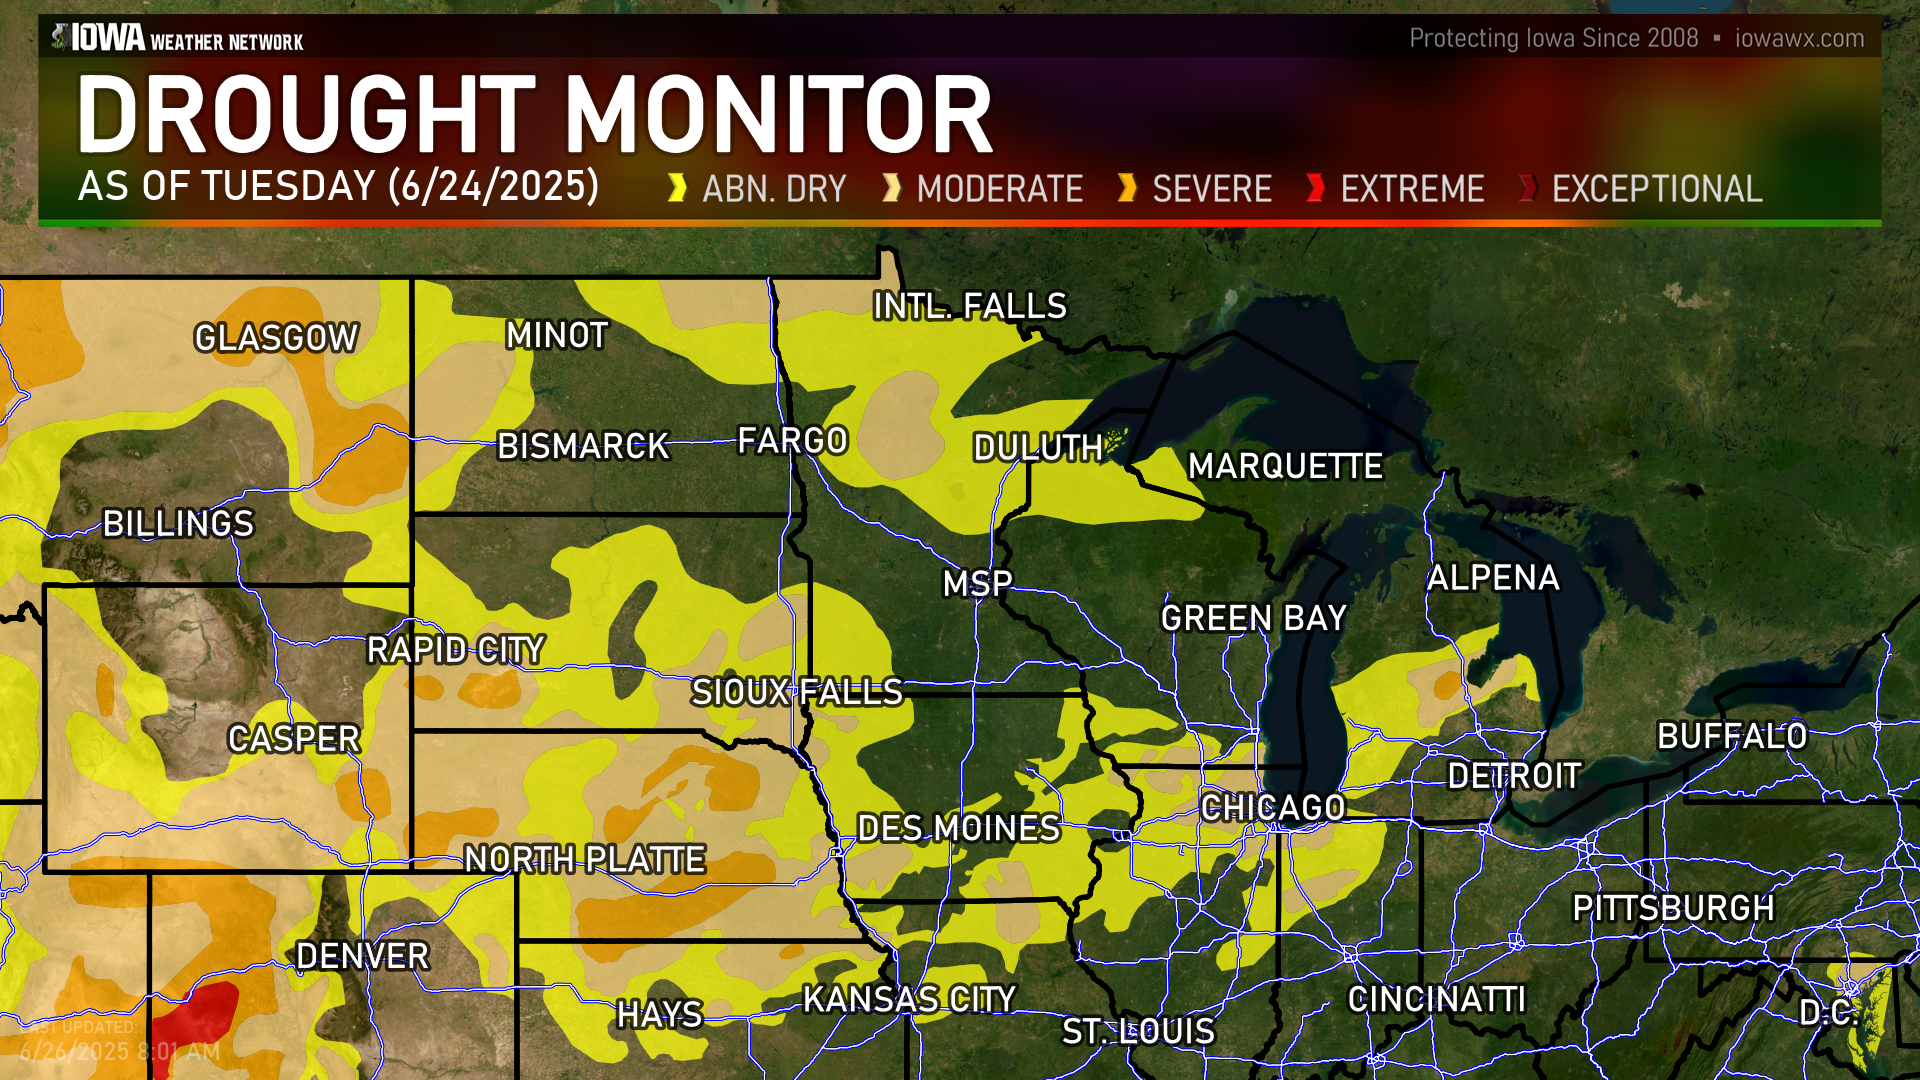
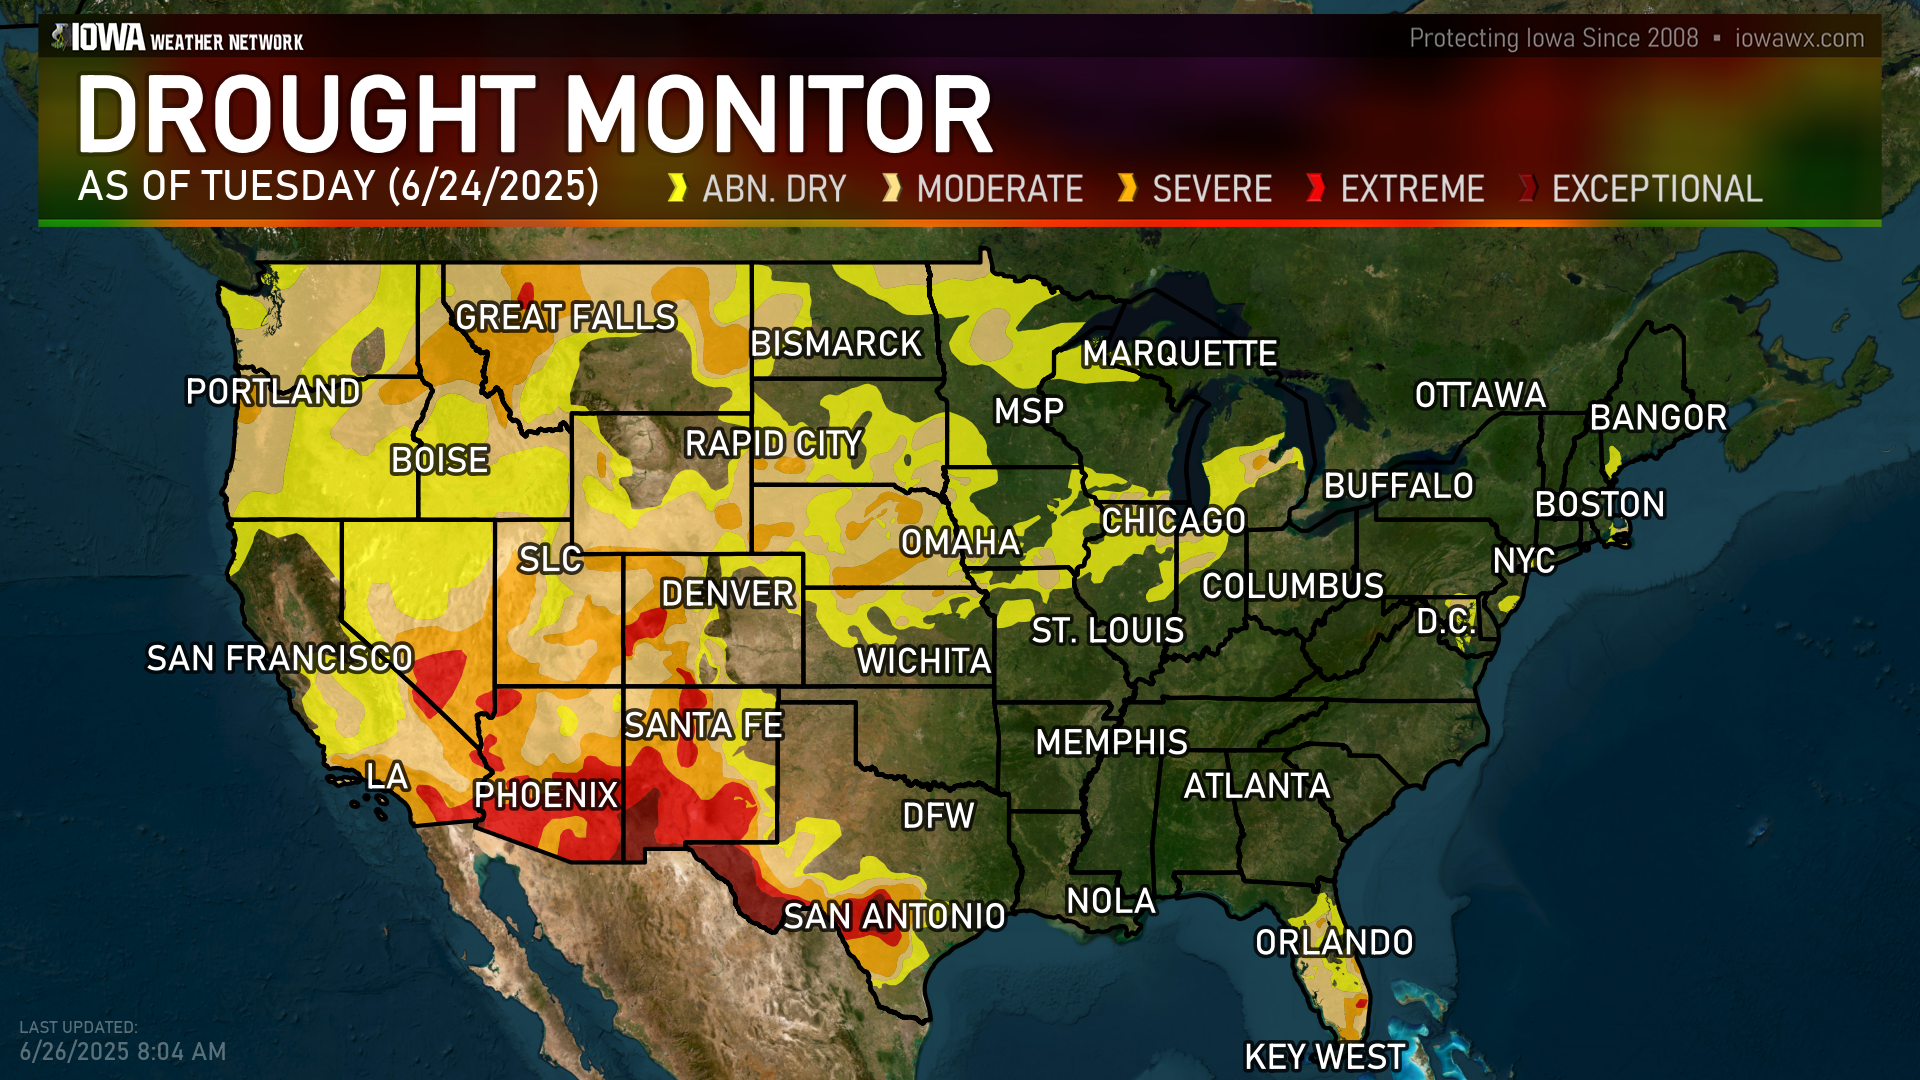
MONITOR
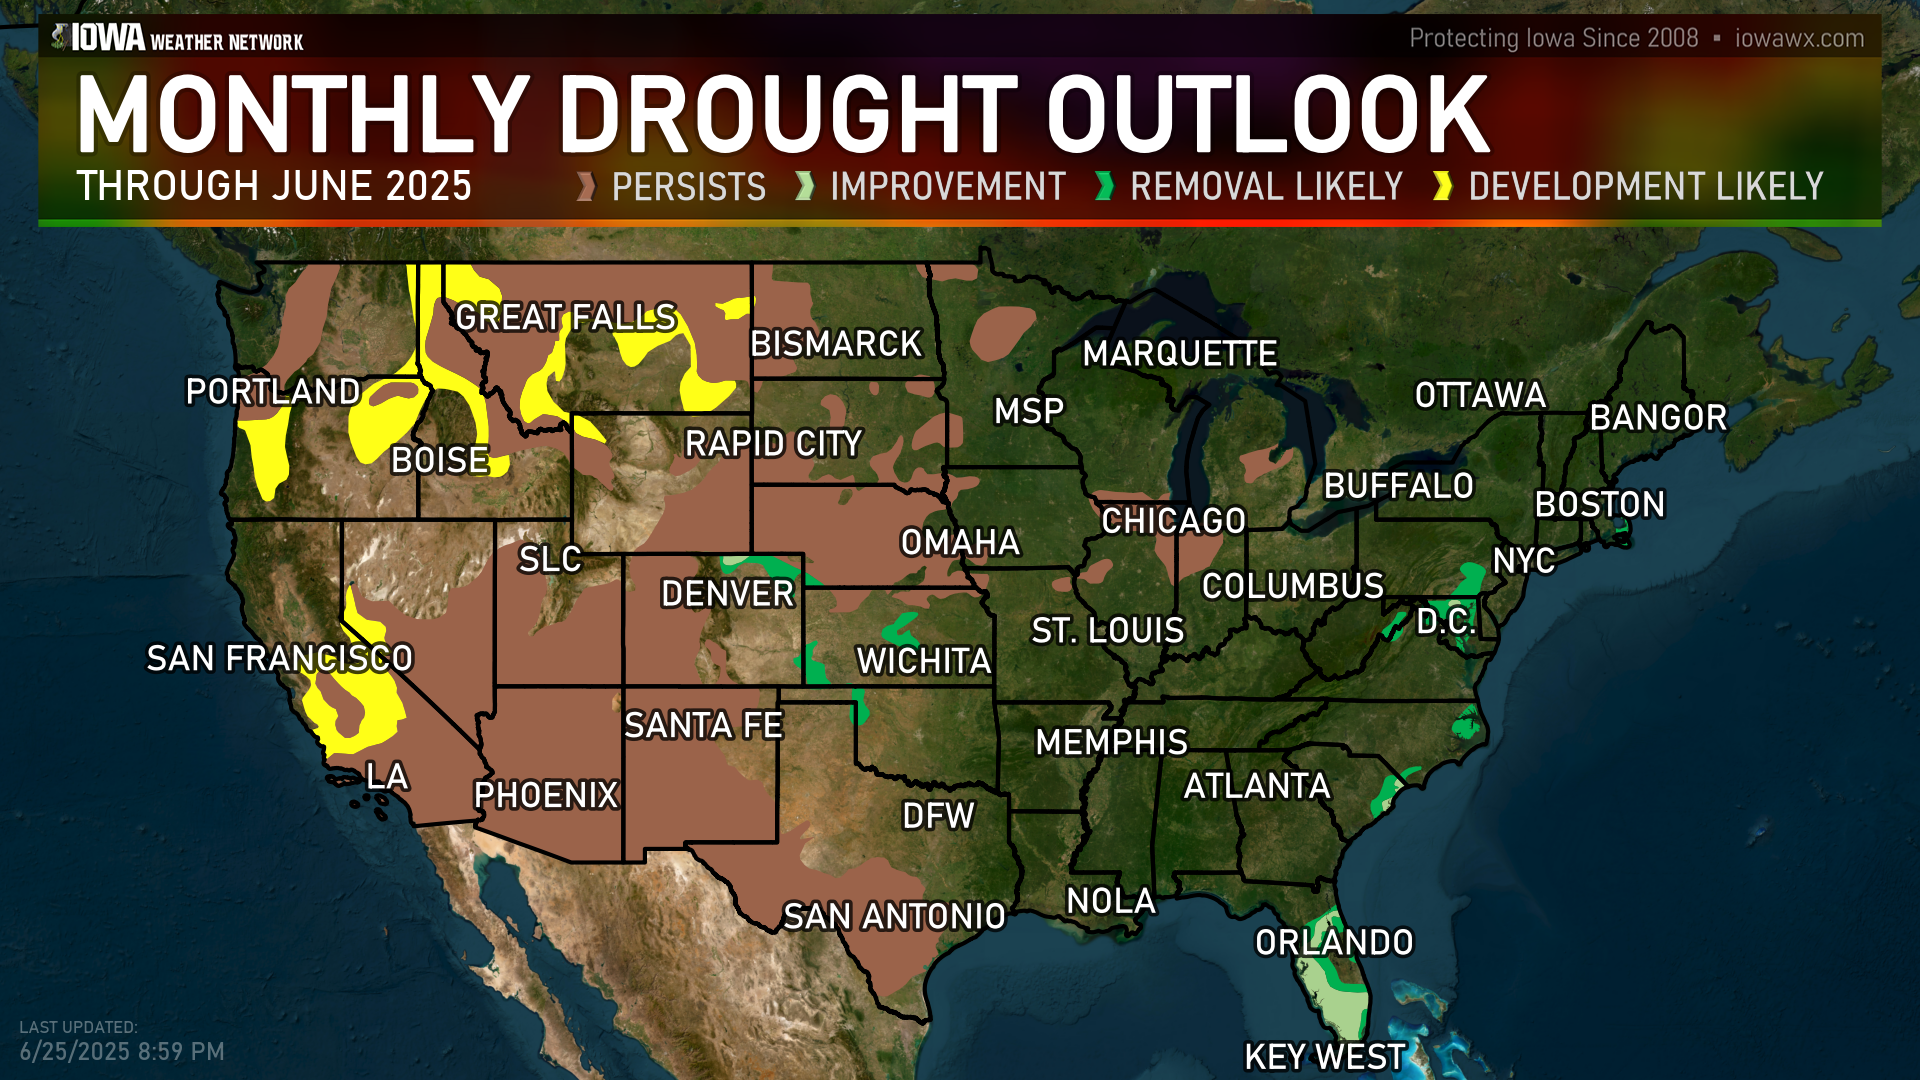
OUTLOOKs
CHANGE OVER TIME


PRECIP. NEEDED TO END
Unavailable
PALMER DROUGHT INDEX
DEPARTURES

VEGETATION (VegDri)


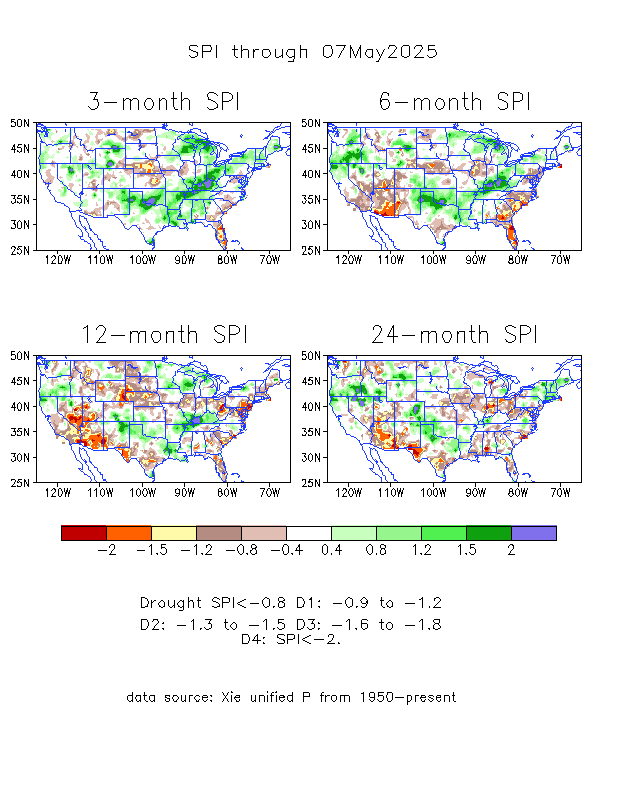
STANDARD PRECIP INDEX
TOPSOIL MOISTURE
STATISTICS
| Week | Date | None | Abnormally Dry | Moderate | Severe | Extreme | Exceptional | DSCI |
|---|---|---|---|---|---|---|---|---|
| Current | 2026-10-13 | 98.64 | 1.36 | 0.00 | 0.00 | 0.00 | 0.00 | 1 |
| Last Week | 2026-10-06 | 98.64 | 1.36 | 0.00 | 0.00 | 0.00 | 0.00 | 1 |
| Start of Water Year | 2026-09-29 | 91.49 | 8.51 | 0.04 | 0.00 | 0.00 | 0.00 | 9 |
| Three Months Ago | 2026-07-14 | 69.48 | 30.52 | 11.31 | 0.00 | 0.00 | 0.00 | 42 |
| Start of Calendar Year | 2025-12-30 | 50.42 | 49.58 | 17.32 | 0.00 | 0.00 | 0.00 | 67 |
| One Year Ago | 2025-10-07 | 49.56 | 50.44 | 0.94 | 0.00 | 0.00 | 0.00 | 51 |


DISCUSSION
Drought conditions changed considerably across the U.S. this week. Heavy rain and early-season snow brought relief to parts of the West and Southeast, while unusually warm and dry weather continued to worsen drought across portions of the Midwest and South. In the West, a strong storm system combined with moisture from the remains of Hurricane Rachel, bringing rain and mountain snow to parts of the region. Snowfall totals reached 11 inches near Philipsburg, Montana, and nearly 10 inches at Great Falls, Montana, while rain and snow also affected portions of Idaho, Wyoming and Utah. Additional precipitation across the Southwest helped improve drought conditions in parts of Arizona, New Mexico and the Rockies. Despite these improvements, significant drought persisted across portions of the Great Basin and Southwest.
Farther east, temperatures averaged 8 to 16 degrees above normal across portions of the Plains and Midwest. Combined with limited rainfall, the unusual warmth contributed to worsening drought across Wisconsin and the Upper Peninsula of Michigan. A broader area of drought deterioration extended from southern Illinois and Indiana through Missouri and Kentucky into the lower Mississippi Valley and Tennessee. Some of the most significant deteriorations occurred across southwestern Missouri, southern Arkansas and northern Louisiana, where persistent warmth and rainfall deficits continued to intensify drought conditions. In contrast, recent rainfall supported localized improvements across western and northern Texas, including portions of the Texas Panhandle.
The Southeast experienced some of the week's most widespread improvements as Hurricane Isaias brought heavy rainfall to the region, with totals exceeding 12 inches in parts of the Florida Panhandle and southern Alabama. Although the rainfall caused localized flooding, it also helped ease drought from Virginia through the Carolinas, Georgia, Alabama and Florida. In the Northeast, drought changes were mixed and largely depended on where precipitation fell. Areas receiving beneficial rainfall experienced localized improvements, while drought persisted or worsened in locations that missed the heavier precipitation.
The Climate Prediction Center’s 6-10 day temperature outlook (Oct. 19–23) favors above-normal temperatures across much of the central and eastern U.S., including the Great Plains, Midwest, Mississippi Valley, Southeast and Northeast. The strongest probabilities for above-normal temperatures are centered over portions of the central Plains and Mississippi Valley, where continued warmth could increase evaporative demand and contribute to additional drying in areas that miss significant precipitation. In contrast, below-normal temperatures are favored across portions of the western U.S., particularly along the West Coast and into the Great Basin and Southwest. The outlook favors near-normal temperatures, while above-normal temperatures are favored across portions of southeastern Alaska.
The Climate Prediction Center’s 6-10 day precipitation outlook (Oct. 19–23) favors above-normal precipitation across much of the western and central U.S., including portions of the West, northern and central Plains, Mississippi Valley and Upper Midwest. These areas may see additional opportunities for drought relief, particularly where recent precipitation has already improved short-term moisture conditions. In contrast, below-normal precipitation is favored across portions of the Northeast, Mid-Atlantic and Ohio and Tennessee Valleys, where continued dryness could reinforce existing precipitation deficits. Above-normal precipitation is also favored across much of Alaska, including portions of the Interior and Southeast Alaska.
Drought conditions intensified across northern and central Wisconsin and the western Upper Peninsula of Michigan, where persistent short- and mid-term precipitation deficits, low streamflows and depleted soil moisture supported the expansion of severe drought (D2) and extreme drought (D3). In central Wisconsin, deterioration extended southward, reflecting worsening conditions across much of the northern and central portions of the state. Additional degradations occurred across southern Illinois, southern Indiana, Missouri and portions of Kentucky, where continued rainfall deficits and above-normal temperatures contributed to worsening drought conditions. The most significant deterioration occurred in southwestern Missouri, where exceptional drought (D4) was introduced following prolonged hot and dry conditions and increasing short- and mid-term moisture deficits. Elsewhere, drought conditions remained largely unchanged across Minnesota, Iowa, Ohio and Lower Michigan, where recent precipitation provided little meaningful relief from existing deficits.
Forecast
Over the next five to seven days (Oct. 15-20), the Weather Prediction Center’s (WPC) five-day quantitative precipitation forecast shows a broad area of precipitation extending from the Southwest and southern Plains northeastward into the Midwest and Great Lakes. The heaviest precipitation is forecast from central and eastern Texas into Oklahoma, Arkansas and Missouri, where widespread totals of 2 to 5 inches are indicated, with localized amounts exceeding 5 inches. Additional precipitation of 1 to 3 inches is forecast across portions of the central Plains, Midwest, Ohio Valley and Great Lakes, with locally higher totals. Heavy precipitation is also forecast along the central Gulf Coast and offshore of Florida, while much of California, Nevada and the interior Southwest are expected to remain relatively dry.The Climate Prediction Center’s 6-10 day temperature outlook (Oct. 19–23) favors above-normal temperatures across much of the central and eastern U.S., including the Great Plains, Midwest, Mississippi Valley, Southeast and Northeast. The strongest probabilities for above-normal temperatures are centered over portions of the central Plains and Mississippi Valley, where continued warmth could increase evaporative demand and contribute to additional drying in areas that miss significant precipitation. In contrast, below-normal temperatures are favored across portions of the western U.S., particularly along the West Coast and into the Great Basin and Southwest. The outlook favors near-normal temperatures, while above-normal temperatures are favored across portions of southeastern Alaska.
The Climate Prediction Center’s 6-10 day precipitation outlook (Oct. 19–23) favors above-normal precipitation across much of the western and central U.S., including portions of the West, northern and central Plains, Mississippi Valley and Upper Midwest. These areas may see additional opportunities for drought relief, particularly where recent precipitation has already improved short-term moisture conditions. In contrast, below-normal precipitation is favored across portions of the Northeast, Mid-Atlantic and Ohio and Tennessee Valleys, where continued dryness could reinforce existing precipitation deficits. Above-normal precipitation is also favored across much of Alaska, including portions of the Interior and Southeast Alaska.
Midwest
Drought conditions generally persisted or worsened across the Midwest, with localized improvements in parts of the region. Temperatures averaged above normal throughout the Midwest, generally ranging from 4 to 12 degrees above normal across much of the Midwest, with the greatest departures across Minnesota, Iowa and Missouri, where some areas were 12 to 16 degrees above normal. The combination of unusually warm temperatures and limited rainfall maintained elevated evaporative demand and contributed to further drying across areas already experiencing drought. Most of the region received less than 50 percent of normal precipitation, with widespread areas receiving less than 25 percent of normal. Localized rainfall occurred across portions of Iowa, Minnesota and northern Michigan, but amounts were generally insufficient to support drought improvements.Drought conditions intensified across northern and central Wisconsin and the western Upper Peninsula of Michigan, where persistent short- and mid-term precipitation deficits, low streamflows and depleted soil moisture supported the expansion of severe drought (D2) and extreme drought (D3). In central Wisconsin, deterioration extended southward, reflecting worsening conditions across much of the northern and central portions of the state. Additional degradations occurred across southern Illinois, southern Indiana, Missouri and portions of Kentucky, where continued rainfall deficits and above-normal temperatures contributed to worsening drought conditions. The most significant deterioration occurred in southwestern Missouri, where exceptional drought (D4) was introduced following prolonged hot and dry conditions and increasing short- and mid-term moisture deficits. Elsewhere, drought conditions remained largely unchanged across Minnesota, Iowa, Ohio and Lower Michigan, where recent precipitation provided little meaningful relief from existing deficits.